Images are a powerful way to communicate ideas — but only if everyone can understand them. Adding alt text and image descriptions ensures that people who use screen readers, text-only browsers, or have slower internet connections can access the same content. Accessible images also support diverse learning styles and remove barriers to understanding.
What Makes an Image Accessible?
Accessible images provide clear, meaningful descriptions that align with the image’s purpose, audience, and platform. There are two key approaches:
- Alternative Text (Alt Text)
A short, meaningful description embedded in HTML or platform settings. Used by screen readers and shown when images don’t load.
- Image Descriptions
A longer explanation added in the visible content—best for complex visuals like infographics, charts, or diagrams.
Best Practices for Writing Alt Text
- Focus on purpose: Why is this image included? What message does it support?
- Be concise but informative (typically under 125 characters).
- Avoid phrases like “image of” or “photo showing”—screen readers announce them already.
- Use names or identifiers when relevant (e.g., “UMBC Retrievers mascot True Grit”).
- Spell out acronyms for screen readers (e.g., “U-M-B-C”).
Tip: Decorative images that do not convey content or meaning can be marked as decorative (null alt text: alt=””).
Complex Images
For images like charts, infographics, data tables, and diagrams:
- Provide a summary of what the image shows and why it matters.
- Include data points, trends, and labels in a longer image description or as surrounding text.
- For tables, recreate them as accessible HTML tables when possible.
Example: Pie Chart
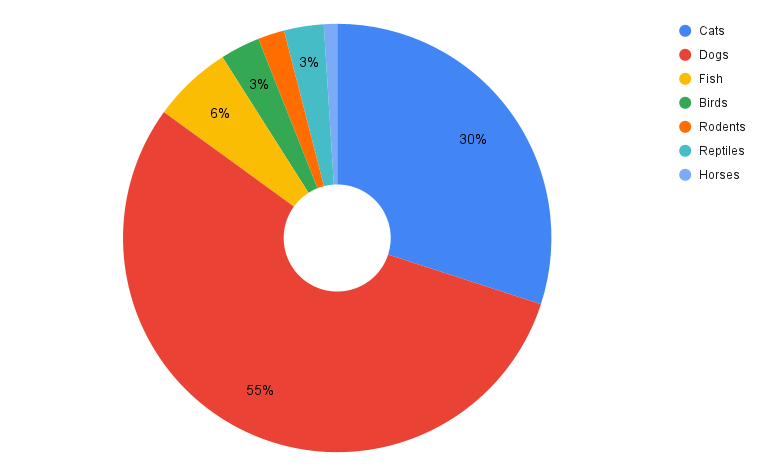
- Alt Text: Pie chart showing pet ownership with Dogs (55%), Cats (30%), others <10%.
- Long Description: Explains the chart title, layout, legend, and data values in detail.
This is a donut-style pie chart titled “Pet Ownership,” illustrating the distribution of various types of pets. The chart features a circular hole in the center, and its segments are colored to represent different animal categories, with percentages indicating their share of total pet ownership. This chart uses a separate legend positioned on the top right. Each item in the legend consists of a small colored circle corresponding to a segment in the chart, followed by the pet category name. The percentage values are displayed directly on or near their respective segments within the donut. The data is presented as follows, listed in the order they appear in the legend from top to bottom:
- Cats: Represented by the blue segment, accounting for 30% of pet ownership.
- Dogs: Represented by the large red segment, making up 55% of pet ownership.
- Fish: Represented by the yellow segment, accounting for 6% of pet ownership.
- Birds: Represented by the green segment, accounting for 3% of pet ownership.
- Rodents: Represented by the orange segment, also accounting for 3% of pet ownership.
- Reptiles: Represented by the light blue segment, accounting for 3% of pet ownership.
- Horses: Represented by a very small light purple segment, accounting for 1% of pet ownership.
Platform-Specific Guidance
The best image description depends on where it’s used. Here’s how to tailor your alt text:
- Blackboard: Instructional value, course content
- Academic documents: Factual tone, names, and historical context
- myUMBC: Event promotion or visual identity
- Social media: Emotion, context, message framing (e.g., “students unite in protest”)
Using AI to Assist with Descriptions
You can use AI tools (like Google Gemini or Microsoft Copilot) to draft image descriptions — but always edit for clarity and context.
Example Prompt (after attaching/uploading your image):
Please describe this image for accessibility. Include:
– A short description (no more than 200 characters)
– A detailed description: This may be one or more paragraphs and must describe the image in great detail so that anyone who does not see it can gain a full understanding of everything in the image. Please format the detailed description such that it will be easily scannable. Use headings, paragraph breaks, and lists as appropriate. Use active voice.
– A caption: This must be no more than two sentences, and should briefly describe the meaning conveyed by the image.
Use the 5 Ps to prompt AI:
- Platform – Where is this image used?
- People – Who is the audience?
- Purpose – What is the image trying to convey?
- Parameters – Keep it brief, plain language, etc.
- Page Context – What content surrounds this image?
For example, if you want to include the 5 Ps, you might also add:
Please provide an accessibility description for the attached image, which is a graphic about responsibility for accessible content.
- Platform: This description will be used on a university’s website, likely within an accessibility resource section.
- People: The audience includes students, faculty, and staff, some of whom may use screen readers or have other visual impairments.
- Purpose: The description needs to convey the image’s main message: that accessible content is everyone’s responsibility, and it should detail the visual elements for those who cannot see them.
- Parameters: The description should be brief (under 200 characters), detailed (multiple paragraphs with headings, lists, and active voice), and include a concise caption (no more than two sentences). Use plain language and avoid jargon.
- Page Context: The image accompanies an article or page discussing the importance of creating accessible educational materials and the roles different university community members play in that effort.
Accessible Graphic Design Tips
- Use high color contrast (avoid UMBC gold on white)
- Don’t rely on color alone to convey meaning
- Use large, readable fonts
- Avoid long blocks of text in images—treat the image like a headline
Resources and How-To Guides